Climate action is entering a new phase driven by digital MRV for carbon capture, real-time IoT monitoring, verified CO₂ removal, ESG reporting, carbon accounting, net-zero strategies, decarbonization, climate compliance and data-driven sustainability solutions.
Businesses, governments, investors, ESG teams and infrastructure developers increasingly require measurable and verifiable climate data rather than sustainability claims based only on estimates or promotional campaigns. Through Digital MRV for carbon capture, IoT carbon monitoring, real-time environmental monitoring and transparent carbon accounting, organisations can track project performance, calculate CO₂ capture, support ESG reporting and demonstrate credible climate impact. This evidence helps stakeholders understand how results were measured, which carbon-capture monitoring methods were used, whether data quality was maintained and whether the reported environmental outcomes can be independently reviewed or verified.
This shift is particularly important for carbon-capture projects.
Installing a carbon-capture system is only the first step. Sustainability teams must also determine:
Table of Contents
- How much CO₂ was captured?
- What was the baseline before installation?
- How consistently did the system operate?
- How much biomass was generated?
- What energy did the system consume?
- What happened to the captured carbon?
- Can the environmental data support ESG reporting?
- Can the results be audited or verified?
Digital MRV helps answer these questions.
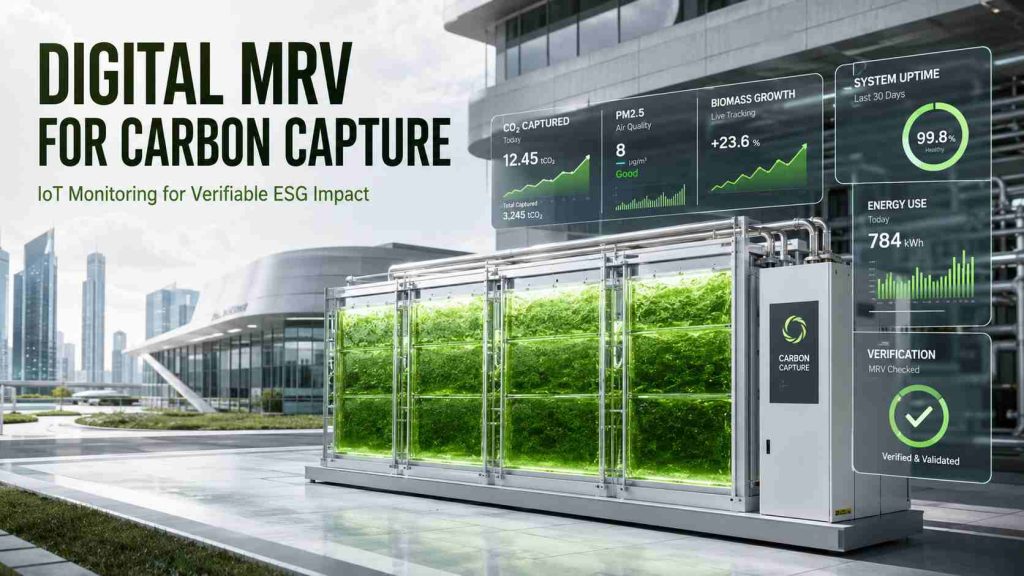
By combining IoT sensors, environmental monitoring, cloud-connected dashboards, operational records and transparent calculation methods, Digital MRV can transform carbon capture from a general environmental claim into a measurable climate programme.
For climate-technology providers such as Carbelim, Digital MRV forms an important bridge between biological carbon capture, environmental intelligence, ESG reporting and long-term carbon management.
What Is MRV in Carbon Capture?
MRV generally stands for Measurement or Monitoring, Reporting and Verification.
It is the structured process used to collect environmental data, calculate project performance, communicate results and confirm that the reported outcomes are reliable.
ISO 14064-2 provides project-level guidance covering baseline selection, monitoring, quantification, data quality and reporting for greenhouse-gas reduction or removal projects. ISO 14064-3 addresses the verification and validation of greenhouse-gas statements. Three Components of MRV
| MRV component | Main purpose | Example in a carbon-capture project |
|---|---|---|
| Measurement or monitoring | Collect environmental and operational data | Monitoring CO₂, airflow, biomass, energy and operating hours |
| Reporting | Convert monitored data into structured information | Monthly ESG reports, pilot reports and performance summaries |
| Verification | Review whether calculations and evidence are reliable | Internal assurance or independent third-party verification |
What Is Digital MRV?
Digital MRV adds connected technology to conventional MRV processes.
A Digital MRV system may include:
- IoT-enabled environmental sensors
- Cloud-connected monitoring devices
- Automated data collection
- Time-stamped records
- Data-quality checks
- Multi-location dashboards
- Carbon calculations
- Operational alerts
- Downloadable reports
- Secure data storage
- API integration with ESG or building-management platforms
Digital MRV does not eliminate the need for human expertise or independent verification. Instead, it improves the frequency, traceability and accessibility of project data.
Digital approaches are also being explored by major carbon-standard organisations. In February 2026, Verra announced the first approved credits under a Digital MRV pilot supporting higher-frequency issuance. Why Carbon-Capture Projects Need MRV
A carbon-capture installation may be technically functional, but organisations still need a credible system for documenting its impact.
Without a defined monitoring plan, it can be difficult to distinguish between:
- Estimated and measured capture
- Gross and net carbon impact
- Temporary and durable carbon storage
- System capacity and actual performance
- Marketing claims and auditable results
- Environmental monitoring and carbon-credit verification
Digital MRV establishes a structured evidence trail.
Climate Claim Versus Verifiable Evidence
| General climate claim | Evidence required for greater credibility |
|---|---|
| “The system captures CO₂” | CO₂ data, biomass records and a documented calculation method |
| “The installation improves air quality” | Baseline and post-installation pollutant measurements |
| “The system supports net zero” | Defined organisational boundary and connection to a wider reduction strategy |
| “The project generates carbon removal” | Evidence of capture, lifecycle emissions and durable carbon storage |
| “The installation can produce carbon credits” | Eligible methodology, additionality, monitoring and independent verification |
| “The system operates continuously” | Time-stamped uptime and equipment-status data |
| “The project has low energy consumption” | Metered energy-use records |
| “The impact is equivalent to trees” | Transparent assumptions, boundaries and comparison methodology |
Digital MRV makes it easier to replace broad statements with structured, evidence-based reporting.
How Digital MRV Works in Biological Carbon Capture
Biological carbon capture uses living organisms such as microalgae to absorb CO₂ through photosynthesis and convert it into biomass.
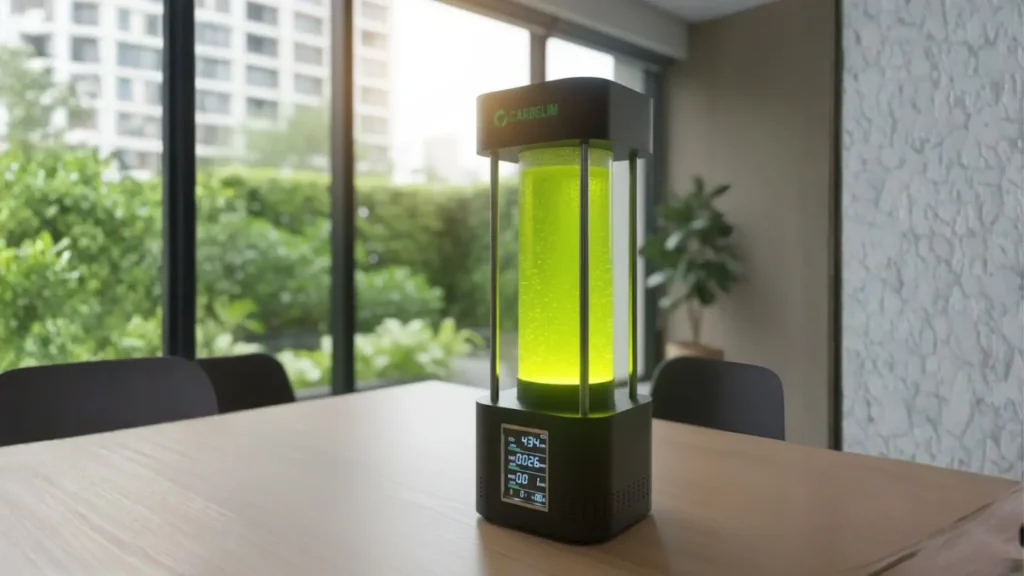
Carbelim develops microalgae photobioreactor systems that can be integrated into buildings, industrial environments and public infrastructure. The company’s website also describes the combination of biological carbon capture with IoT monitoring, carbon accounting and environmental analytics. l MRV system for biological carbon capture can follow the process below.
Digital MRV Workflow
| Stage | Activity | Main output |
|---|---|---|
| 1. Project definition | Establish the installation, objectives and monitoring boundary | Project monitoring plan |
| 2. Baseline assessment | Measure conditions before deployment | Baseline dataset |
| 3. System commissioning | Record reactor capacity, sensors and operating configuration | Commissioning record |
| 4. Continuous environmental monitoring | Measure CO₂, particulate matter and other environmental parameters | Environmental dataset |
| 5. Biological monitoring | Track algae growth, culture condition and biomass production | Biological-performance data |
| 6. Operational monitoring | Record uptime, airflow, pumps, lighting and maintenance | Operational dataset |
| 7. Energy monitoring | Measure electricity used by equipment | Energy-consumption record |
| 8. Carbon calculation | Convert validated data into estimated carbon capture | Carbon-performance result |
| 9. Quality assurance | Review missing values, calibration and abnormal readings | Validated dataset |
| 10. Reporting | Produce monthly, quarterly or annual reports | ESG and project reports |
| 11. Verification | Review data and methods against the selected framework | Verification conclusion |
| 12. Carbon-storage tracking | Document the final biomass or biochar pathway | Carbon chain-of-custody record |
Establishing a Carbon-Capture Baseline
A baseline represents the environmental or emissions condition that would exist without the project.
It gives organisations a reference against which project performance can be evaluated.
For example, an air-purification and carbon-capture installation in a commercial building may collect baseline measurements for:
- Indoor CO₂
- PM1.0
- PM2.5
- PM10
- TVOC
- Temperature
- Relative humidity
- Occupancy
- Ventilation conditions
- Outdoor air quality
An industrial biological CCUS project may require additional baseline information, such as:
- Flue-gas composition
- CO₂ concentration
- Gas-flow rate
- Operating schedule
- Production rate
- Existing emissions-control systems
- Energy use
- Seasonal operating variations
Carbelim’s Industrial CCUS solutions and Direct Air Capture platform address different carbon-capture environments. Industrial CCUS focuses on source-related industrial applications, while biological DAC addresses CO₂ already present in ambient air. baseline should be:
- Representative of normal conditions
- Collected over a suitable monitoring period
- Supported by calibrated instruments
- Documented with location and time information
- Adjusted for important factors such as occupancy or production
- Stored in a format that can be reviewed later
What Should Be Monitored in a Microalgae Carbon-Capture System?
A comprehensive monitoring programme should consider environmental, biological, operational and energy-related indicators.
Environmental Parameters
| Parameter | Why it matters | Potential reporting use |
|---|---|---|
| CO₂ | Indicates carbon-dioxide concentration around the project | Baseline and trend analysis |
| PM1.0 | Measures very fine particulate matter | Air-quality reporting |
| PM2.5 | Important indicator of fine-particle pollution | ESG and exposure assessments |
| PM10 | Measures larger inhalable particles | Ambient and indoor air reporting |
| TVOC | Indicates volatile organic compound levels | Indoor environmental-quality reporting |
| CO | Identifies combustion-related pollution | Safety and environmental monitoring |
| NO₂ | Relevant around roads and combustion sources | Urban and industrial monitoring |
| O₃ | Useful in ambient-air assessments | Outdoor air-quality analysis |
| Temperature | Influences sensor readings and biological performance | Operational context |
| Relative humidity | Influences comfort, sensors and system conditions | Environmental context |
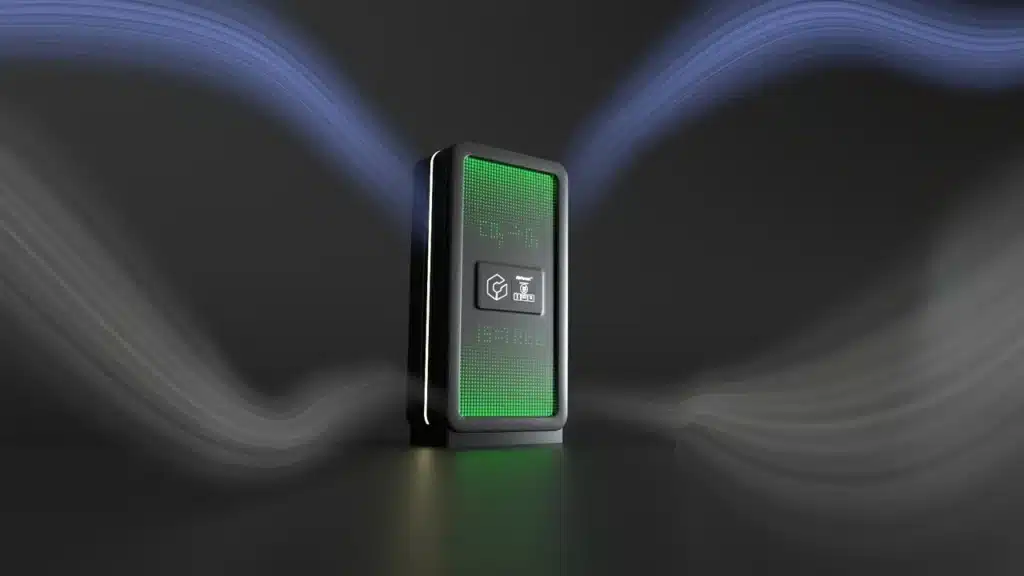
Carbelim’s Air Quality Monitoring Solutions cover indoor and outdoor environmental monitoring, including particulate matter, CO₂, CO, TVOC, temperature and humidity. The platform also offers historical analytics, alerts, multi-site monitoring and API integration. ogical Parameters
| Parameter | Purpose |
|---|---|
| Photobioreactor working volume | Establishes the active algae-culture capacity |
| Optical density | Indicates change in algae concentration |
| Dry biomass weight | Supports biomass and carbon calculations |
| Algae growth rate | Measures biological productivity |
| pH | Helps evaluate culture stability |
| Culture temperature | Influences biological growth |
| Light intensity | Influences photosynthetic performance |
| Nutrient concentration | Supports stable culture operation |
| Dissolved oxygen | Provides information about photosynthetic activity |
| Harvest quantity | Supports biomass chain-of-custody records |
Operational Parameters
| Parameter | Purpose |
|---|---|
| System uptime | Confirms operational availability |
| Pump runtime | Tracks fluid circulation |
| Airflow rate | Records gas-contact conditions |
| Aeration status | Indicates gas transfer into the culture |
| Lighting hours | Tracks assisted-lighting operation |
| Sensor status | Identifies monitoring interruptions |
| Alarm records | Documents abnormal conditions |
| Maintenance history | Explains downtime and performance changes |
| Nutrient dosing | Records culture-management activities |
| Harvest schedule | Documents biomass removal |
Energy and Resource Parameters
| Parameter | Why it should be recorded |
|---|---|
| Electricity consumption | Supports net-carbon calculations |
| Water consumption | Evaluates resource efficiency |
| Nutrient use | Supports operational and lifecycle accounting |
| Replacement components | Identifies material inputs |
| Maintenance travel | May be relevant to lifecycle emissions |
| Biomass transportation | Influences the final carbon outcome |
| Pyrolysis energy | Important when biomass is converted into biochar |
The Role of IoT Sensors in Carbon Monitoring
IoT sensors allow data to be collected continuously or at defined intervals rather than relying only on occasional manual readings.
The information can be transmitted to a cloud platform where it is organised, visualised and compared across multiple periods or locations.
Advantages of IoT Carbon Monitoring
- Frequent environmental-data collection
- Automatic time and date records
- Multi-location monitoring
- Faster identification of system problems
- Reduced manual data entry
- Historical performance analysis
- Automated threshold alerts
- Remote asset management
- Integration with building-management systems
- Easier preparation of sustainability reports
Carbelim’s environmental platform includes live dashboards, historical analytics, configurable alerts and multi-site management. It can also support API integration with BMS, ERP and third-party environmental platforms. IoT monitoring should not be treated as automatically accurate.
Sensor data can be affected by:
- Sensor drift
- Incorrect placement
- Poor calibration
- Communication failures
- Condensation
- Dust accumulation
- Electrical interruptions
- Temperature and humidity effects
- Incorrect units
- Duplicate data
- Missing records
Digital MRV must therefore include data-quality procedures.
Data Quality and Calibration in Digital MRV
A monitoring system is only as reliable as the data it produces.
Recommended Data-Quality Controls
| Control | Purpose |
|---|---|
| Initial sensor calibration | Establish reliable performance before deployment |
| Periodic recalibration | Identify and correct sensor drift |
| Reference-instrument comparison | Compare readings against a trusted instrument |
| Automated range checks | Flag values outside realistic limits |
| Missing-data alerts | Identify communication or sensor failures |
| Duplicate-data checks | Prevent repeated values from affecting calculations |
| Location documentation | Confirm where each sensor is installed |
| Maintenance records | Explain data interruptions |
| Version control | Record changes to formulas and software |
| Manual review | Identify errors that automated checks may miss |
The monitoring report should clearly describe:
- Sensor make and model
- Measurement range
- Accuracy
- Calibration date
- Sampling frequency
- Installation location
- Data-availability percentage
- Missing-data treatment
- Calculation formulas
- Responsible personnel
What Should a Carbon-Capture Dashboard Show?
A useful dashboard should do more than display attractive graphs.
It should help operations teams, ESG managers and decision-makers understand whether the project is performing as intended.
Recommended Dashboard Structure
| Dashboard section | Recommended information |
|---|---|
| Live environment | CO₂, PM1.0, PM2.5, PM10, TVOC, temperature and humidity |
| System condition | Online status, pump condition, airflow and active alarms |
| Carbon performance | Daily, monthly and annual estimated capture |
| Biological performance | Optical density, pH, biomass and growth trend |
| Energy performance | Daily and cumulative electricity consumption |
| Asset availability | Uptime, downtime and data availability |
| Comparative analysis | Baseline versus current conditions |
| Multi-site map | Status and performance of distributed assets |
| Maintenance | Completed and upcoming service activities |
| Reporting | Downloadable monthly and quarterly reports |
| Data quality | Calibration status and missing-data percentage |
| Alerts | Threshold exceedances and system warnings |
Carbelim’s existing article on turning climate data into actionable insights explains how real-time monitoring, cloud-based aggregation and analytics can support environmental decision-making. Digital MRV extends this approach by creating a more formal structure for carbon quantification, reporting and verification. Gross Carbon Capture Versus Net Carbon Removal
One of the most important concepts in carbon accounting is the difference between gross capture and net removal.
Carbon Accounting Terms
| Term | Meaning |
|---|---|
| Gross carbon capture | Total CO₂ absorbed or fixed by the system before deductions |
| Operational emissions | Emissions from electricity, maintenance, materials and transport |
| Biomass carbon | Carbon temporarily stored in algae biomass |
| Durable carbon storage | Carbon transferred into a longer-lasting storage pathway |
| Net carbon removal | Gross removal after relevant emissions and losses are deducted |
| Verified removal | Carbon removal reviewed using an accepted verification process |
| Credited removal | Verified removal issued as a carbon credit under an eligible programme |
Capturing CO₂ in growing algae does not automatically mean that the carbon has been permanently removed from the atmosphere.
The final outcome depends on what happens to the harvested biomass.
Biomass Pathway and Carbon Outcome
| Biomass pathway | General carbon implication |
|---|---|
| Rapid decomposition | Carbon may return to the atmosphere relatively quickly |
| Animal feed | Carbon is generally stored for a limited period |
| Biofuel | Carbon is normally released when the fuel is used |
| Bioplastic | Storage depends on product life and disposal |
| Fertiliser or soil application | Outcome depends on biomass stability |
| Biochar production | Can support longer-duration carbon storage when properly produced and managed |
Carbelim describes an end-to-end pathway in which algal biomass can be combined with organic residues and converted through pyrolysis into engineered biochar. The website positions this pathway as part of a longer-term carbon-storage strategy. Can Digital MRV Generate Carbon Credits?
Digital MRV can support carbon-credit development, but a dashboard alone cannot create verified carbon credits.
A credible carbon-credit project may require:
- An eligible project activity
- An accepted methodology
- A defined baseline
- Additionality
- Project boundaries
- Monitoring procedures
- Leakage assessment
- Lifecycle accounting
- Permanence provisions
- Risk management
- Data-quality controls
- Independent validation
- Independent verification
- Registry approval
The Verified Carbon Standard, for example, establishes requirements and methodologies for projects seeking verified carbon units. Digital systems may make monitoring and verification more efficient, but they must still comply with the selected programme and methodology. mmended Claim Language
Avoid saying:
Our IoT dashboard automatically generates verified carbon credits.
Use instead:
Our IoT-enabled monitoring platform can support transparent data collection, carbon accounting and MRV-ready reporting. Eligibility for carbon credits depends on the selected methodology, project design, additionality, permanence and independent verification.
This distinction protects technical credibility and reduces the risk of overstating a project’s carbon-market readiness.
Digital MRV for ESG Reporting
ESG teams often receive environmental information from multiple departments, spreadsheets, service providers and individual facilities.
Digital MRV can create a more structured data flow.
How Different Teams Use Digital MRV
| Stakeholder | Potential use |
|---|---|
| Sustainability manager | Track environmental KPIs and progress |
| ESG reporting team | Prepare evidence-based disclosures |
| Facility manager | Monitor equipment and indoor air quality |
| EHS team | Identify environmental and exposure risks |
| Operations team | Improve system uptime and efficiency |
| Finance team | Evaluate cost per unit of environmental impact |
| Senior management | Review portfolio-level sustainability performance |
| Government authority | Monitor public-infrastructure projects |
| Investor | Assess environmental performance and scalability |
| Auditor | Review data sources, assumptions and calculations |
| Carbon-project developer | Prepare monitoring documentation |
| Communications team | Publish better-supported sustainability claims |
ESG Metrics That Can Be Reported
- Estimated gross CO₂ capture
- Estimated net carbon impact
- System operating hours
- Percentage uptime
- Biomass productivity
- Air-quality improvement
- Energy consumption
- Water use
- Number of monitored locations
- Number of people or facilities served
- Maintenance compliance
- Data availability
- Biomass harvested
- Biochar produced
- Carbon-storage pathway
Digital MRV should be integrated into a broader sustainability strategy rather than treated as a replacement for organisation-wide greenhouse-gas accounting.
Digital MRV Applications Across Industries
Commercial Buildings and Corporate Campuses
Commercial properties can use Digital MRV to monitor:
- Indoor CO₂
- Particulate matter
- Ventilation conditions
- Energy consumption
- Carbon-capture performance
- Occupant environmental quality
- Distributed climate assets
Carbelim’s Biomimetic Façade integrates microalgae photobioreactor panels into building architecture and includes IoT monitoring and building-management integration as part of its proposed system design. strial and Manufacturing Facilities
Industrial projects may monitor:
- Inlet CO₂ concentration
- Outlet CO₂ concentration
- Gas-flow rate
- Operating hours
- Biomass production
- Process energy
- Production output
- System downtime
Digital MRV can help industries evaluate whether a biological CCUS pilot is technically and commercially suitable before larger deployment.
Airports and Metro Stations
Transport infrastructure can use Digital MRV for:
- Indoor and outdoor air-quality monitoring
- Baseline environmental assessments
- PM2.5 and PM10 trends
- Passenger-zone CO₂
- Multi-location asset monitoring
- Public-facing environmental dashboards
- ESG and sustainability reports
Smart Cities and Public Infrastructure
A city may deploy multiple climate assets across:
- Roadsides
- Bus shelters
- Parks
- Public plazas
- Metro stations
- Government campuses
- Pedestrian zones
- High-pollution corridors
Carbelim’s PureAir Network™ is positioned as a distributed network of microalgae-powered environmental infrastructure. Digital MRV can allow each asset to be monitored individually while also presenting city-wide performance. s and Traffic Corridors
Carbelim BioDivider™ Panels can convert road dividers and urban barriers into distributed biological carbon-capture assets.
Monitoring networks can compare:
- Traffic periods
- PM concentrations
- CO₂ trends
- Weather conditions
- System uptime
- Corridor-level performance
Parks and Public Spaces
Outdoor biological air-purification systems such as the Carbelim Tree can be installed in parks, campuses, airports, transit locations and high-footfall public areas.
A public dashboard can help communicate:
- Current air quality
- Daily operating hours
- Environmental trends
- Carbon-capture estimates
- Maintenance status
- Network-level impact
Research Institutions and Universities
Research teams can use Carbelim’s Custom Photobioreactor Design Platform to configure systems with sensors, aeration, lighting, automation and IoT controls.
Digital MRV can support:
- Controlled experiments
- Strain comparisons
- Biomass studies
- Carbon-capture trials
- Wastewater-treatment research
- Industrial-gas testing
- Long-term performance studies
Digital MRV Versus Manual Reporting
| Factor | Manual environmental reporting | Digital MRV |
|---|---|---|
| Data collection | Periodic and labour-intensive | Continuous or high-frequency |
| Time records | May require manual entry | Automatically time-stamped |
| Multi-site management | Difficult | Centralised |
| Missing-data detection | Often delayed | Automated alerts possible |
| Reporting speed | Slower | Faster |
| Data visualisation | Requires manual preparation | Live dashboards |
| Traceability | Depends on spreadsheets | Structured records |
| Calculation updates | Manual | Can be automated |
| Error risk | Manual-entry errors | Configuration and sensor errors remain possible |
| Calibration | Required | Still required |
| Human review | Required | Still required |
| Independent verification | Possible | Possible |
| Carbon-credit guarantee | No | No |
Digital MRV improves efficiency, but it should not create a false impression that climate data is automatically accurate or verified.
A Practical Digital MRV Implementation Roadmap
Phase 1: Define the Project
Establish:
- Project objective
- Installation location
- Carbon-capture technology
- Reporting period
- Monitoring boundary
- Responsible stakeholders
- Intended reporting use
Phase 2: Complete the Baseline Assessment
Record representative environmental and operational conditions before the project begins.
Phase 3: Develop the Monitoring Plan
Specify:
- Parameters
- Sensors
- Sampling frequency
- Calibration schedule
- Data storage
- Quality controls
- Reporting format
Phase 4: Install and Commission the System
Confirm:
- Sensor placement
- Equipment configuration
- Network connectivity
- Dashboard operation
- Baseline references
- Data transmission
Phase 5: Operate the Pilot
A structured pilot should establish:
- Clear milestones
- Performance indicators
- Review intervals
- Maintenance responsibilities
- Data-quality requirements
- Final deliverables
Phase 6: Review Performance
Compare actual results against:
- Baseline conditions
- Technical expectations
- Energy targets
- Uptime targets
- Biological-productivity targets
- Environmental KPIs
Phase 7: Prepare the MRV Report
The report should include:
- Project description
- System boundary
- Monitoring methodology
- Baseline
- Data availability
- Calculations
- Assumptions
- Results
- Limitations
- Maintenance history
- Carbon-storage pathway
- Recommendations
Phase 8: Determine Verification Requirements
The level of verification depends on whether the results are intended for:
- Internal project management
- CSR reporting
- ESG disclosures
- Investor communication
- Regulatory reporting
- Green-building certification
- Carbon-credit issuance
Using a Carbon-Capture Calculator
A calculator can help organisations estimate the potential performance of a microalgae system before deployment.
Carbelim’s Microalgae Carbon Capture Calculator uses inputs such as optical density, photobioreactor working volume, operating days and system efficiency to estimate annual CO₂ capture. calculator outputs should be treated as planning estimates until they are supported by:
- Actual operating data
- Biomass measurements
- System-specific efficiency
- Energy accounting
- Maintenance records
- Laboratory analysis
- Defined carbon-content assumptions
A calculator is therefore useful during feasibility assessment, while Digital MRV is needed to track actual project performance.
What Makes a Digital MRV System Credible?
A credible system should demonstrate five qualities.
1. Transparency
The user should understand where data comes from and how results are calculated.
2. Traceability
Every result should be linked to underlying records, time periods and data sources.
3. Consistency
Monitoring methods and formulas should be applied consistently across reporting periods.
4. Accuracy
Sensors, laboratory methods and calculations should be appropriate for the intended use.
5. Verifiability
Data and assumptions should be organised so that another qualified party can review them.
Digital MRV Credibility Checklist
| Question | Good-practice response |
|---|---|
| Are the formulas documented? | Yes |
| Are assumptions visible? | Yes |
| Are sensors calibrated? | Yes |
| Is missing data reported? | Yes |
| Are gross and net impact separated? | Yes |
| Is energy consumption included? | Yes |
| Is the biomass pathway documented? | Yes |
| Are results linked to time-stamped records? | Yes |
| Can reports be exported? | Yes |
| Is third-party verification possible? | Yes |
How Carbelim Connects Carbon Capture and Environmental Intelligence
Carbelim’s approach combines biological systems, environmental monitoring and data-driven reporting.
The wider technology ecosystem includes:
- Microalgae-based carbon capture
- Photobioreactor engineering
- Indoor and outdoor air-quality monitoring
- IoT-connected sensor networks
- Environmental dashboards
- Biomass tracking
- Biochar pathways
- Digital environmental reporting
- Distributed climate infrastructure
Carbelim Technology Layers
| Technology layer | Function |
|---|---|
| Capture layer | Microalgae absorb CO₂ through photosynthesis |
| Air-quality layer | Sensors track environmental parameters |
| Biological layer | Culture condition and biomass are monitored |
| Operational layer | Equipment status and uptime are recorded |
| Energy layer | Electricity and resource use are measured |
| Data layer | Information is transmitted to a cloud platform |
| Intelligence layer | Dashboards show trends, alerts and KPIs |
| Reporting layer | Results are converted into project and ESG reports |
| Circularity layer | Biomass is directed toward selected applications |
| Storage layer | Eligible biomass may enter durable storage pathways |
| Verification layer | Records can support technical and external review |
Carbelim’s stated positioning combines biological CCUS with IoT-enabled monitoring, carbon accounting, environmental analytics and resource recovery for buildings, industries and public infrastructure. Conclusion: From Climate Claims to Measurable Impact
The future of carbon capture will depend not only on how much CO₂ a technology can potentially capture, but also on how clearly its performance can be measured, reported and verified.
Digital MRV helps organisations establish that evidence.
By combining environmental sensors, biological measurements, operational records, energy monitoring and structured carbon calculations, Digital MRV enables carbon-capture projects to become more:
- Transparent
- Measurable
- Comparable
- Scalable
- Auditable
- ESG-ready
- Operationally efficient
For biological carbon-capture systems, this is especially important.
Microalgae can absorb CO₂ and convert it into biomass, but credible climate reporting must also account for system operation, energy consumption, biomass handling and the final carbon-storage pathway.
Digital MRV creates the framework needed to connect these individual elements.
The result is a transition from visible sustainability infrastructure to measurable environmental performance—and from climate ambition to documented climate action.
Call to Action
Move From Sustainability Claims to Measurable Climate Performance
Carbelim develops microalgae-based carbon-capture systems, IoT-enabled air-quality monitoring and environmental intelligence solutions for commercial buildings, industries, campuses, airports, metro systems and smart-city infrastructure.
Organisations can begin with:
- An environmental baseline assessment
- Air-quality monitoring
- A carbon-capture feasibility study
- A monitored technology pilot
- A Digital MRV framework
- A multi-location sustainability programme
Contact Carbelim to discuss a monitored carbon-capture pilot or environmental intelligence programme for your organisation.
Frequently Asked Questions
What is Digital MRV in carbon capture?
Digital MRV is the use of connected sensors, software, cloud platforms and structured calculations to monitor, report and support verification of carbon-capture performance.
What does MRV stand for?
MRV usually stands for Measurement or Monitoring, Reporting and Verification.
Why is Digital MRV important for ESG reporting?
Digital MRV provides structured, time-stamped environmental data that can help organisations support ESG disclosures, internal sustainability reporting and stakeholder communication.
Can IoT sensors directly measure total carbon removal?
IoT sensors can measure parameters such as CO₂ concentration, airflow, temperature, particulate matter and system status. Total carbon-removal calculations may also require biomass measurement, energy accounting and documented assumptions.
How is carbon captured by microalgae measured?
Potential methods include optical-density monitoring, dry biomass measurement, culture-volume records and analysis of biomass carbon content. The selected calculation method should be documented and consistently applied.
Does an ESG dashboard guarantee accurate data?
No. Dashboards display the information received from sensors and calculations. Calibration, sensor placement, data validation and technical review are still required.
Does Digital MRV automatically create carbon credits?
No. Digital MRV can support monitoring and reporting, but carbon-credit issuance requires an eligible methodology, additionality, verification and approval under the selected carbon programme.
What is the difference between gross carbon capture and net carbon removal?
Gross carbon capture is the total amount captured before deductions. Net carbon removal accounts for relevant emissions, energy use, losses and the durability of the final storage pathway.
Why should electricity consumption be monitored?
Electricity used by pumps, lighting, aeration, sensors and control systems can affect the project’s net climate impact.
Can Digital MRV be used for smart-city projects?
Yes. It can support multi-location monitoring of environmental assets installed at roadsides, parks, bus shelters, airports, metro stations and public buildings.
Can Digital MRV support indoor air-quality management?
Yes. It can track parameters such as CO₂, PM1.0, PM2.5, PM10, TVOC, temperature and relative humidity across buildings and occupied spaces.
What industries can use Digital MRV?
Potential users include manufacturing, real estate, airports, metro systems, educational campuses, hospitals, commercial offices, smart cities and public-infrastructure operators.
What should be included in a carbon-capture monitoring report?
A monitoring report should include project boundaries, baseline information, monitored parameters, sensor details, calibration information, calculations, energy consumption, downtime, biomass data, limitations and results.
Can a carbon-capture calculator replace actual monitoring?
No. A calculator supports initial estimation and feasibility analysis. Actual project reporting should use measured operating and environmental data.
How can an organisation start a Digital MRV project?
The organisation should begin by defining its project objective, conducting a baseline assessment, selecting monitoring parameters, installing calibrated equipment and establishing reporting and quality-control procedures.